A cause-effect graph is a directed graph that maps a set of causes to a set of effects. The causes may be thought of as the input to the program, and the effects may be thought of as the output. Usually the graph shows the nodes representing the causes on the left side and the nodes representing the effects on the right side. There may be intermediate nodes inbetween that combine inputs using logical operators such as AND and OR. The Cause-Effect Graphing technique was invented by Bill Elmendorf of IBM in 1973.
There are four steps:
Causes (input conditions) and effects (actions) are listed for a module
and an identifier is assigned to each.
A cause-effect graph is developed.
The graph is converted to a decision table.
Decision table rules are converted to test cases.
The Cause-Effect Graphing technique begins with the set of requirements, and determines the minimum number of test cases to completely cover the requirements.
Test Case Review
Once the test cases have been derived by the test case designer, the
RBT process includes the review of these test cases by the following
stakeholders:
The author of the requirements verifies that he/she agrees with the
test case designer’s translation of requirements to test cases.
The domain experts review the test cases in order to determine the answer to the following question: “Are we building the right system”?
The developers review the test cases to clarify their understanding of the requirements. The developers learn what they will be tested on, and can therefore develop the software to succeed. By performing these reviews, everyone on the project team can obtain the same understanding of what will be built.
A Simple Cause-Effect Graphing Example
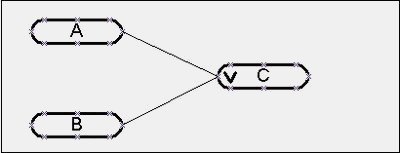
I have a requirement that says: “If A OR B, then C.” The following rules hold for this requirement:
• If A is true and B is true, then C is true.
• If A is true and B is false, then C is true.
• If A is false and B is true, then C is true.
• If A is false and B is false, then C is false.
The cause-effect graph that represents this requirement is provided in Figure below. The cause-effect graph shows the relationship between the causes and effects.

In Figure above, A, B and C are called nodes. Nodes A and B are the causes, while Node C is an effect. Each node can have a true or false condition. The lines, called vectors, connect the cause nodes A and B to the effect node C.
All requirements are translated into nodes and relationships on the cause-effect graph. There are only four possible relationships among nodes, and they are indicated by the following symbols:
