Graphical Method Algorithm: Linear Programming
The details for this method are as follows.
 Steps in Graphical Method Algorithm for Solving LPP
1. Formulate the mathematical model of the given linear programming problem (LPP).
2. Treat inequalities as equalities and then draw the lines corresponding to each equation and non-negativity restrictions.
3. Locate the end points (corner points) on the feasible region.
4. Determine the value of the objective function corresponding to the end points determined in step 3.
5. Find out the optimal value of the objective function.
The following examples illustrate the method.
Linear Programming Graphical Method Examples
 Example 1
Maximize z = 18x1 + 16x2
subject to
15x1 + 25x2 ≤
375
24x1 + 11x2 ≤
264
x1, x2 ≥ 0
Solution.
If only x1 and no x2 is produced, the maximum value of x1 is 375/15 = 25. If only x2 and no x1 is produced, the maximum value of x2 is 375/25 = 15. A line drawn between these two points (25, 0) & (0, 15), represents the constraint factor 15x1 + 25x2 ≤ 375. Any point which lies on or below this line will satisfy this inequality and the solution will be somewhere in the region bounded by it.
Similarly, the line for the second constraint 24x1 + 11x2 ≤ 264 can be drawn. The polygon oabc represents the region of values for x1 & x2 that satisfy all the constraints. This polygon is called the solution set.
The solution to this simple problem is exhibited graphically below.

The end points (corner points) of the shaded area are (0,0), (11,0), (5.7, 11.58) and (0,15). The values of the objective function at these points are 0, 198, 288 (approx.) and 240. Out of these four values, 288 is maximum.
The optimal solution is at the extreme point b, where x1 = 5.7 & x2 = 11.58, and z = 288.
 Graphical Method in LPP: Example 2
Maximize z = 6x1 - 2x2
subject to
2x1 - x2 ≤ 2
x1 ≤ 3
x1, x2 ≥ 0
Solution.
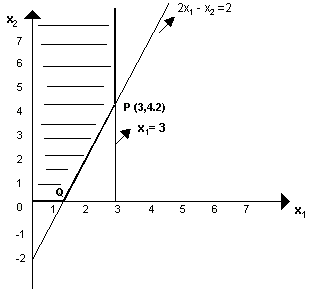
First, we draw the line 2x1 - x2 ≤ 2, which passes through the points (1, 0) & (0, -2). Any point which lies on or below this line will satisfy this inequality and the solution will be somewhere in the region bounded by it.
Similarly, the line for the second constraint x1 ≤ 3 is drawn. Thus, the optimal solution lies at one of the corner points of the dark shaded portion bounded by these straight lines.

Optimal solution is x1 = 3, x2 = 4.2, and the maximum value of z is 9.6.


