Transshipment Model
In a transportation problem, consignments are always transported from an origin to a destination.
But, there could be several situations where it might be economical to transport items via one or more intermediate centres (or stages). In a transshipment problem, the available commodity is not sent directly from sources to destinations, i.e., it passes through one or more intermediate points before reaching the actual destination.
Example of Transshipment Model
A company has nine large stores located in several states. The sales department is interested in reducing the price of a certain product in order to dispose all the stock now in hand. But, before that the management wants to reposition its stock among the nine stores according to its sales expectations at each location.

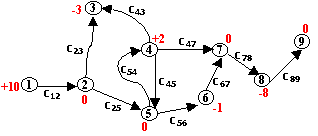
The above figure shows the numbered nodes (9 stores). A positive value next to a store represents the amount of inventory to be redistributed to the rest of the system. A negative value represents the shortage of stock. Thus, stores 1 and 4 have excess stock of 10 & 2 items respectively. Stores 3, 6 & 8 need 3, 1, and 8 more items respectively. The inventory positions of stores 2, 5 & 7 are to remain unchanged.
An item may be shipped through stores 2, 4, 5, 6, 7 & 8. These locations are known as transshipment points. Each remaining store is a source if it has excess stock, and a sink if it needs stock. In the above figure, store 1 is a source and store 3 is a sink.
The value cij is the cost of transporting items. To transport
an item from store 1 to store 3, the total shipping cost is
c12 + c23
In the following example, you will learn how to convert a transshipment problem to a standard transportation problem.
 Example
Consider a transportation problem where the origins are plants and destinations are depots. The unit transportation costs, capacity at the plants, and the requirements at the depots are indicated below:
Table 1
| Plant | Depot | |||
|---|---|---|---|---|
| X | Y | Z | ||
| A | 1 | 3 | 15 | 150 |
| B | 3 | 5 | 25 | 300 |
| 150 | 150 | 150 | 450 | |
When each plant is also considered a destination and each depot is also considered an origin, there are altogether five origins and five destinations. Some additional cost data are also necessary. These are presented in the following Tables.
Table 2
| Unit Transportation Cost from Plant to Plant | ||
|---|---|---|
| From Plant | To | |
| Plant A | Plant B | |
| A | 0 | 65 |
| B | 1 | 0 |
Table 3
| Unit Transportation Cost from Depot to Depot | |||
|---|---|---|---|
| From Depot | To | ||
| Depot X | Depot Y | Depot Z | |
| X | 0 | 23 | 1 |
| Y | 1 | 0 | 3 |
| Z | 65 | 3 | 0 |
Table 4
| Unit Transportation Cost from Depot to Plant | ||
|---|---|---|
| Depot | Plant | |
| A | B | |
| X | 3 | 15 |
| Y | 25 | 3 |
| Z | 45 | 55 |
Solution.
From Table 1, Table 2, Table 3 and Table 4 we obtain the transportation formulation of the transshipment problem.
Table 5
| Transshipment Table | ||||||
|---|---|---|---|---|---|---|
| A | B | X | Y | Z | Capacity | |
| A | 0 | 65 | 1 | 3 | 15 | 150 + 450 = 600 |
| B | 1 | 0 | 3 | 5 | 25 | 300 + 450 = 750 |
| X | 3 | 15 | 0 | 23 | 1 | 450 |
| Y | 25 | 3 | 1 | 0 | 3 | 450 |
| Z | 45 | 55 | 65 | 3 | 0 | 450 |
| Requirement | 450 | 450 | 150 + 450 =600 | 150 + 450 =600 | 150 + 450 =600 | 2700 |
The transportation model is extended and now it includes five supply points & demand points. To have a supply and demand from all the points, a fictitious supply and demand quantity (buffer stock) of 450 is added to both supply and demand of all the points. An initial basic feasible solution is obtained by the Vogel's Approximation method and is shown in the final table.
Final Table
| Transshipment Table | ||||||
|---|---|---|---|---|---|---|
| A | B | X | Y | Z | Capacity | |
| A | 65 | 15 | 600 | |||
| B | 3 | 5 | 25 | 750 | ||
| X | 3 | 15 | 23 | 450 | ||
| Y | 25 | 3 | 1 | 3 | 450 | |
| Z | 45 | 55 | 65 | 3 | 450 | |
| Requirement | 450 | 450 | 600 | 600 | 600 | 2700 |
The total transhipment cost is:
0 X 150 + 1 X 300 + 3 X 150 + 1 X 300 + 0 X 450 + 0 X 300 + 1 X 150
+ 0 X 450 + 0 X 450 = 1200


